Facebook ads testing strategy has witnessed few changes in 2019. I released three stages of Facebook ads testing videos in 2018 that was very well-received. This post will walk you through the entire “First Sale Chart”. You can check out the video here.
After running the Facebook ads for three days, if the return on ad spend (ROAS) is less than 3, the ads were shut down in 2018. For instance, if a product is priced at 20 to 30 % higher than the cost of the price on Aliexpress and ROAS is 3, loss is bound to occur.

Realistic Facebook Ads Testing approach
Which Store should I go in – General Store or Niche Store?
There are a lot of YouTube videos on testing products for Dropshipping stores, testing the Facebook ads. Some videos are about product stores and some are about niche stores. I will be focusing on the general Stores because it gives you the flexibility to test a lot of different products on a budget.
Testing phase products strategy
Testing product strategy is closely related to spending and selection of General or Niche stores. When you are testing as a beginner and you are unsure if the product is a winner or not, it does not make sense to spend thousands of dollars just to get data and bring up the pixel volume. The product may or may not work. But experienced marketers, who are aware of the demographics, language, interests of their niche, and when they have the data, lookalike audiences are built.
How to spend your money effectively on a budget?

Breakeven ROAS refers to the point where return on ad spends break even. Though we are more interested in profits, Breakeven ROAS can be a good metric when you are actually running your ads. You can compare your actual return on ad spend, compare it with your breakeven return on ad spend and then assess if the actual return has been higher than the break even. If the actual return is higher, you will know that you are in profit otherwise you are in a loss.
How to calculate your break-even ROAS?

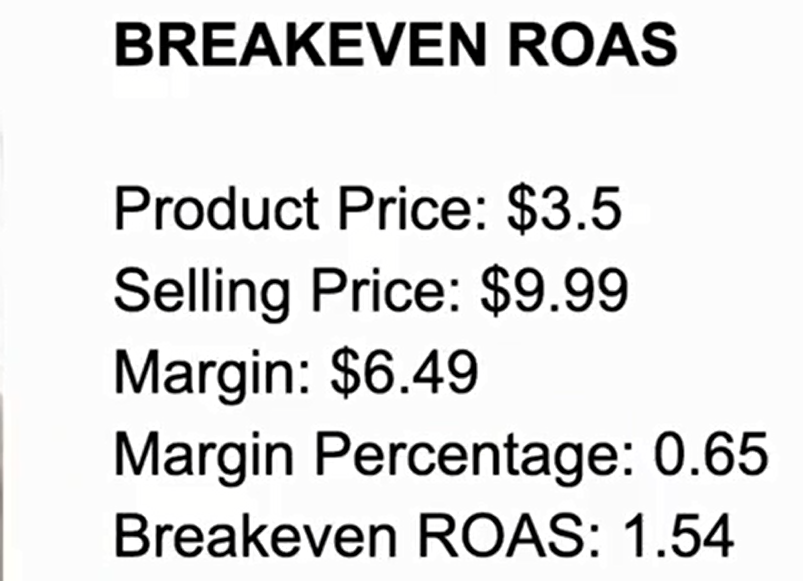
Product price = the price quoted on Aliexpress
Selling Price = the price that you have quoted for the product
Margin = Selling Price – (minus) Product Price
Margin Percentage = Margin / (divided by) Selling Price = $6.49 /$9.99
Breakeven ROAS = 1/ (divided by) margin percentage = 1/0.65 If you are running your ads for this product and get a ROAS of 1.7 it means you are making profit.
Tuber

What is the significance of Tuber?
You tend to incur a lot of other expenses when you are running your business. This is true especially for people who are living outside the United States. A lot of my audience is from countries like Monaco, Australia and Great Britain. While selling in USD they will be incurring a currency conversion charge. I incur a currency conversion charge for every transaction that happened.
Scenario – 1
Let us assume that you place an order on Ali Express. Your local cards are in Indian rupees but the cards get charged in USD. So the banks, Visa and MasterCard take a currency conversion charge which actually ends up impacting your revenue earned.
Scenario – 2
Let us consider the payment scenario. When you are paying for Facebook ads, if your Facebook ad account is in USD and your local currency is something different, the banks will charge a currency conversion charge and that is going to actually impact your profit margins.
Scenario – 3
You have a PayPal account and you get a remittance of thousand dollars in that PayPal account from your e-commerce business. When people transfer that USD into your local bank account there is a currency conversion charge. Finally, you end up paying about 7 to 8% of your overall revenue which is a significant amount.
Transaction Charges
Transaction charges vary between 2.5 to 4% depending upon the payment gateway you use. If you are using Shopify payments it is about 2.6 to 2.9% depending on the Shopify plan. If you have PayPal, transaction charges for USD transaction in India are about 4.4% depending on the volume. It solely depends on what your transaction rate with the payment providers you are associated with are.
Refunds
You get a refund rate of one to two percent generally in ecommerce. It depends upon the customer support and the kind of product you are selling. You need to aim for 1% and the worst possible case would be 2%. If you have Virtual Assistants to handle customer support and order fulfilment you have to include this cost as well. Added to this cost are Shopify apps and Shopify subscription fee. Initially your sale volume might be pretty low, say 100 to 200 dollars a month. In that case the basic Shopify plan at 29 dollars a month is also big percentage eating into your revenue but when you scale up that percentage becomes negligent. Your total expenses total up to 15% of your revenue.

Applying the Tuber Principle
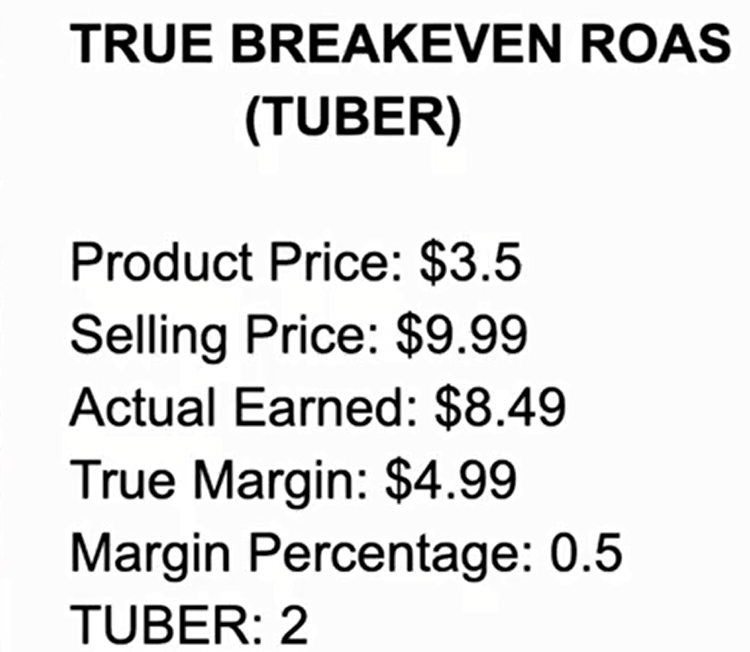
When you apply the Tuber Principle to the same product including the Currency Conversion, Transaction fees, Refunds, VAs, the actual earnings accumulating in your bank account will not be 9.9. You have to subtract 15% from the total revenue which comes to 8.49.
True Revenue = Actual Earned – (minus) Product Price = $4.99
Margin Percentage = True margin / (divided by) Selling Price = 0.5 Tuber (True Return on Ad Spend) = 1 / (divided by) 0.5 = 2

Earlier the break-even was 1.54 and now the tuber is 2.
Let us assume that your actual ROAS is 1.9 which means you are at a profit. But taking into consideration, especially for the people residing outside the US, 7% currency conversion fee that is applicable eats a chunk of your entire revenue. Your tuber is 2 so actually you are in a loss because your true break-even ad spend is 2
My First Sale Chart of 2019

Download the first sale chart here
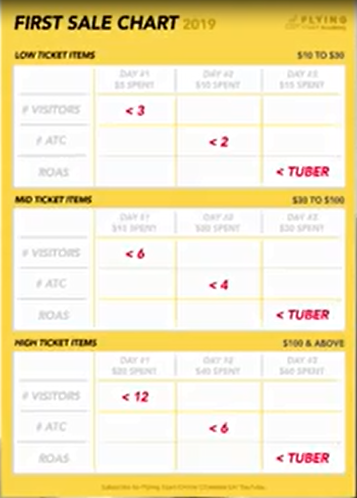
You can see three tiers namely Low Ticket Items, Mid Ticket Items and High Ticket Items
Low Ticket Items:
If you’re running low ticket items then you have to try three ad sets with a five dollar budget each.
Mid Ticket Items:
If you’re doing mid ticket items, you have to try three ad sets with a ten dollar budget
High Ticket Items:
If you’re doing high ticket items, you have to try three ad sets with a twenty dollar budget
Note: if you’re not familiar at all with the for sale chart I would highly recommend you check out the FB ad Stage #2 video released in 2018 which really walks you through the entire chart.
How to interpret the First Sale Chart?
Let us explain with a low ticket item which will cater to the majority of the audience.
Steps
- Advertise your products ranging between 10 to 30 dollars
- Run 3 ad sets with a $5 budget each
- On the first day (24 hours), run the ads
- Check all the 3 ad sets and look for 3 clicks on each ad set
- Close down the ad set that has not get at least 3 unique outbound links
- On the second day (after 48 hours) you would have spent 10 dollars on particular ad sets
- Check out the number of Add-to-Carts
- If an ad set has less than 2 Add-to-Carts shut down that ad set
- On the 3rd day you would have spent 15 dollars on the ad sets that are left
- Calculate the Tuber and asses if the ROAS is actually greater than Tuber
- You will have a ROAS if there are purchases
- If there are no purchases, your ROAS will be zero which is less than Tuber
With the first sale chart we do a realistic calculation that lets you know your real profit. Once you know your tuber you can make precise data-driven decisions that matter in your business. In order to make profit you need to know your table.

