Does your Facebook ads statistics puzzle you? Are you worried if you are reading Facebook Ads statistics the right way? This is something that you should monitor closely while running your Facebook ads. A lot of beginners are totally clueless when these numbers pop up. Even if they are aware of these numbers, they don’t know to interpret the number analytics and how to arrive at these numbers.
One of the crucial components is ROAS (Return on Ad Spends) which determines if the Ads are worth the spending. ROAS is a common question raised by many till date because they do not have a thorough understanding of ROAS and try to find out the methods of calculating the ROAS, for their campaigns for their Shopify stores.
Do you wish to know what these numbers actually mean and its implications? Check out this video to access my actual running Facebook account. You can also set up your account in such a way to read and analyze your Facebook ads numbers in a much better way.
Reading my Facebook Ads account Statistics
Nail Gel Product

These numbers can be overwhelming for a beginner. So, let us proceed with a root cause analysis and decipher what these figures actually mean.
Setting up the Columns

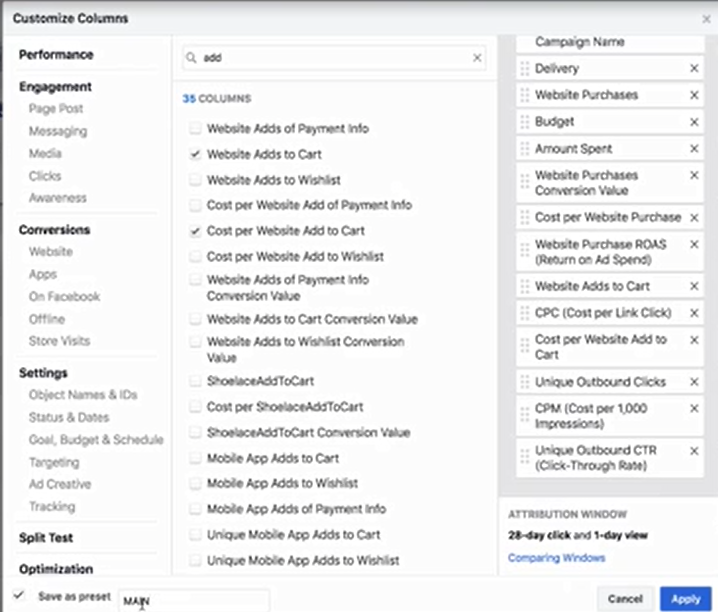
On the right-hand side you will see “Columns” with the name “Main”. Your columns will not have “Main” as the name but “Performance” by default. Click Customize Columns that will open up a pop-up window to display all the columns that are available.
Facebook tracks all activities on your website, ads and shows all these data. You need not have to know or track all these data. You only need a few columns and in a particular order for better readability.

The first column should be “Campaign Name”, the second column should be “Delivery” and so on as shown above in the figure (Columns Selected). If you remove the check in any column attribute that shows below the Search, the same disappears in the “Columns Selected”. To bring it back to the Columns Selected section, check the attribute.
You can drag and drop any column attribute (for e.g. Delivery) and release it to display it in the place you want. Say, below the Campaign Name.

If you need to add more columns, use the Search field. Set up the columns click on Save as Preset and give it a name as “Main” or “Primary” or any name that you wish to. Click Apply.
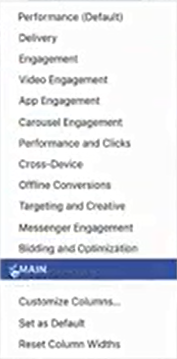
In the future if you reload the page all you need to do is click on the preset Column Name; in our case it is “MAIN” as shown below. All the columns will be shown on the console and the data corresponding to your ad sets and Campaigns will be displayed to enhance the readability.

Definitions
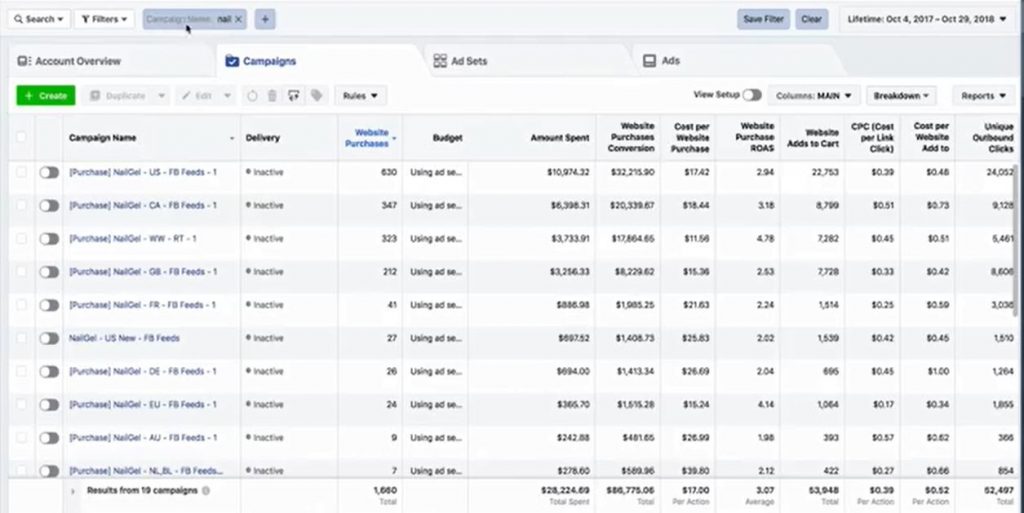
Website Purchases

The number of purchases occurred driven by a particular campaign is displayed here. The amount spent for the Ad Set budget is shown in the Amount Spent column.
If I click on the campaign, the columns remain the same but the data related to the Ad set for this campaign will display. I can sort the results by clicking on the column header.

Website Purchases Conversion
This is the total amount of revenue generated using the ads inside a particular campaign.
Cost per Website Purchase
This indicates the cost per conversion while running Facebook ads for conversion.
ROAS
ROAS is the returns on ads spent.
Website Adds to Cart
The number of ads to Cart happening because of a campaign
Ad Set Data
If you go inside the campaign and go to the ad set level then you’ll see the same stats for particular ad sets and the data should be related to the ad set level.
Unique Outbound clicks
This component is important when you’re looking at the first sales chart according to my FB Ads Stage #2 method
CPM
Cost per 1000 impressions
Note: When you are analyzing the First Sales Chart, “Website Adds to Cart”, “Unique Outbound clicks” and ROAS metrics play a very important part in analyzing the FB ads data.
Beginners’ Challenges
A lot of beginners face issues interpreting this data and they end up spending more on Facebook Ads. They are not even able to find out if they are getting purchases, if the ROAS is positive and all these issues put together lead to a loss making Store.
Conclusion
This is all the data that you need to be looking at and setup the columns in the way I just showed you to get you going.

